Monitoring
Monitoring
Goma Gateway offers built-in monitoring capabilities to help you track the health, performance, and behavior of your gateway and its routes. Metrics are exposed in a Prometheus-compatible format and can be visualized using tools like Prometheus and Grafana.
The monitoring section in the configuration enables you to control observability features such as Prometheus metrics, readiness/liveness probes, and detailed route health checks.
Configuration Options
| Key | Type | Default | Description |
|---|---|---|---|
host | string | "" | Restricts access to observability endpoints to a specific hostname. |
enableMetrics | bool | false | Enables the Prometheus-compatible /metrics endpoint. |
metricsPath | string | /metrics | Sets a custom path for metrics exposure. |
visitorTTL | string | 5m | How long a visitor keeps counting towards the real-time visitors gauge after their last request. |
enableReadiness | bool | true | Enables the /readyz readiness probe endpoint. |
enableLiveness | bool | true | Enables the /healthz liveness probe endpoint. |
enableRouteHealthCheck | bool | false | Enables the /healthz/routes endpoint for route-level health checks. |
includeRouteHealthErrors | bool | false | Includes route errors in the /healthz/routes response if true. |
middleware.metrics | []string | [] | Middleware chain applied to the metrics endpoint. |
middleware.routeHealthCheck | []string | [] | Middleware chain applied to the route health check endpoint. |
💡 Note: If
hostis not set, observability endpoints are accessible from any route host. To restrict access, set a specifichostvalue.
Route-Level Metrics
By default, each route collects metrics. You can opt out of metrics for a specific route by setting:
disableMetrics: true
Example Monitoring Configuration
gateway:
  monitoring:
    enableMetrics: true                  # Enable Prometheus metrics
    metricsPath: /metrics                # Custom metrics path (optional)
    visitorTTL: 5m                       # How long a visitor counts as active (optional)
    enableReadiness: true               # Enable /readyz endpoint
    enableLiveness: true                # Enable /healthz endpoint
    enableRouteHealthCheck: true        # Enable /healthz/routes
    includeRouteHealthErrors: true      # Include route errors in health checks
    middleware:
      metrics:
        - ldap-auth                         # Middleware for /metrics
      routeHealthCheck:
        - ldap-auth                          # Middleware for /healthz/routes
Accessing Metrics
Once configured, metrics are available at:
http://<gateway-host>:<port>/metrics
You can configure Prometheus to scrape this endpoint and use Grafana for visualization.
Health Endpoints
In addition to performance metrics, Goma Gateway provides dedicated endpoints to monitor health:
- Liveness Probe:
/healthz - Readiness Probe:
/readyz - Route Health Check:
/healthz/routes(if enabled)
All endpoints return structured JSON indicating the current status.
Prometheus Scrape Configuration Example
scrape_configs:
  - job_name: "gateway"
    metrics_path: "/metrics"  # Optional, defaults to /metrics
    scheme: http              # Use https if TLS is enabled
    scrape_interval: 15s
    static_configs:
      - targets: ["gateway-host:port"]
        labels:
          application: "goma_gateway"
    basic_auth:               # Optional: enable if your gateway requires authentication
      username: username
      password: password
    tls_config:
      insecure_skip_verify: false
Available Metrics
Goma Gateway exposes several Prometheus metrics to monitor the gateway at various levels:
gateway_uptime_seconds— Uptime of the gateway application in seconds since startup"gateway_routes_count— Current number of registered routes in the gateway.gateway_middlewares_count— Current number of registered middlewares in the gateway.gateway_realtime_visitors_count— Number of currently connected real-time active visitors(5m).gateway_requests_total— Total number of requests processed by the gateway.gateway_response_status_total— Total number of HTTP responses sent, labeled by status code, route name, and method.gateway_request_duration_seconds— Histogram of request durations in seconds.gateway_total_errors_intercepted— Total number of errors intercepted, labeled by route name and status code.gateway_request_bytes_total— Total request body bytes received, labeled by route name and method (bandwidth in).gateway_response_bytes_total— Total response body bytes sent, labeled by route name and method (bandwidth out).gateway_upstream_duration_seconds— Histogram of upstream/backend response durations, by route. Lets you separate "my app is slow" from "the gateway is slow" (gateway overhead = request − upstream).gateway_requests_by_country_total— Requests by route name and client country (ISO code, from GeoIP). Only recorded when a GeoIP database is configured.gateway_geoblock_denied_total— Requests denied by ageoBlockmiddleware, labeled by middleware name and country.- And many more...
💡 Web-performance metrics. The bandwidth (
*_bytes_total), upstream-duration, and by-country metrics power per-route traffic, throughput and latency-split views. Miabi consumes the richer event stream below to build full traffic/performance/web-analytics dashboards — see Analytics.
Grafana Dashboard
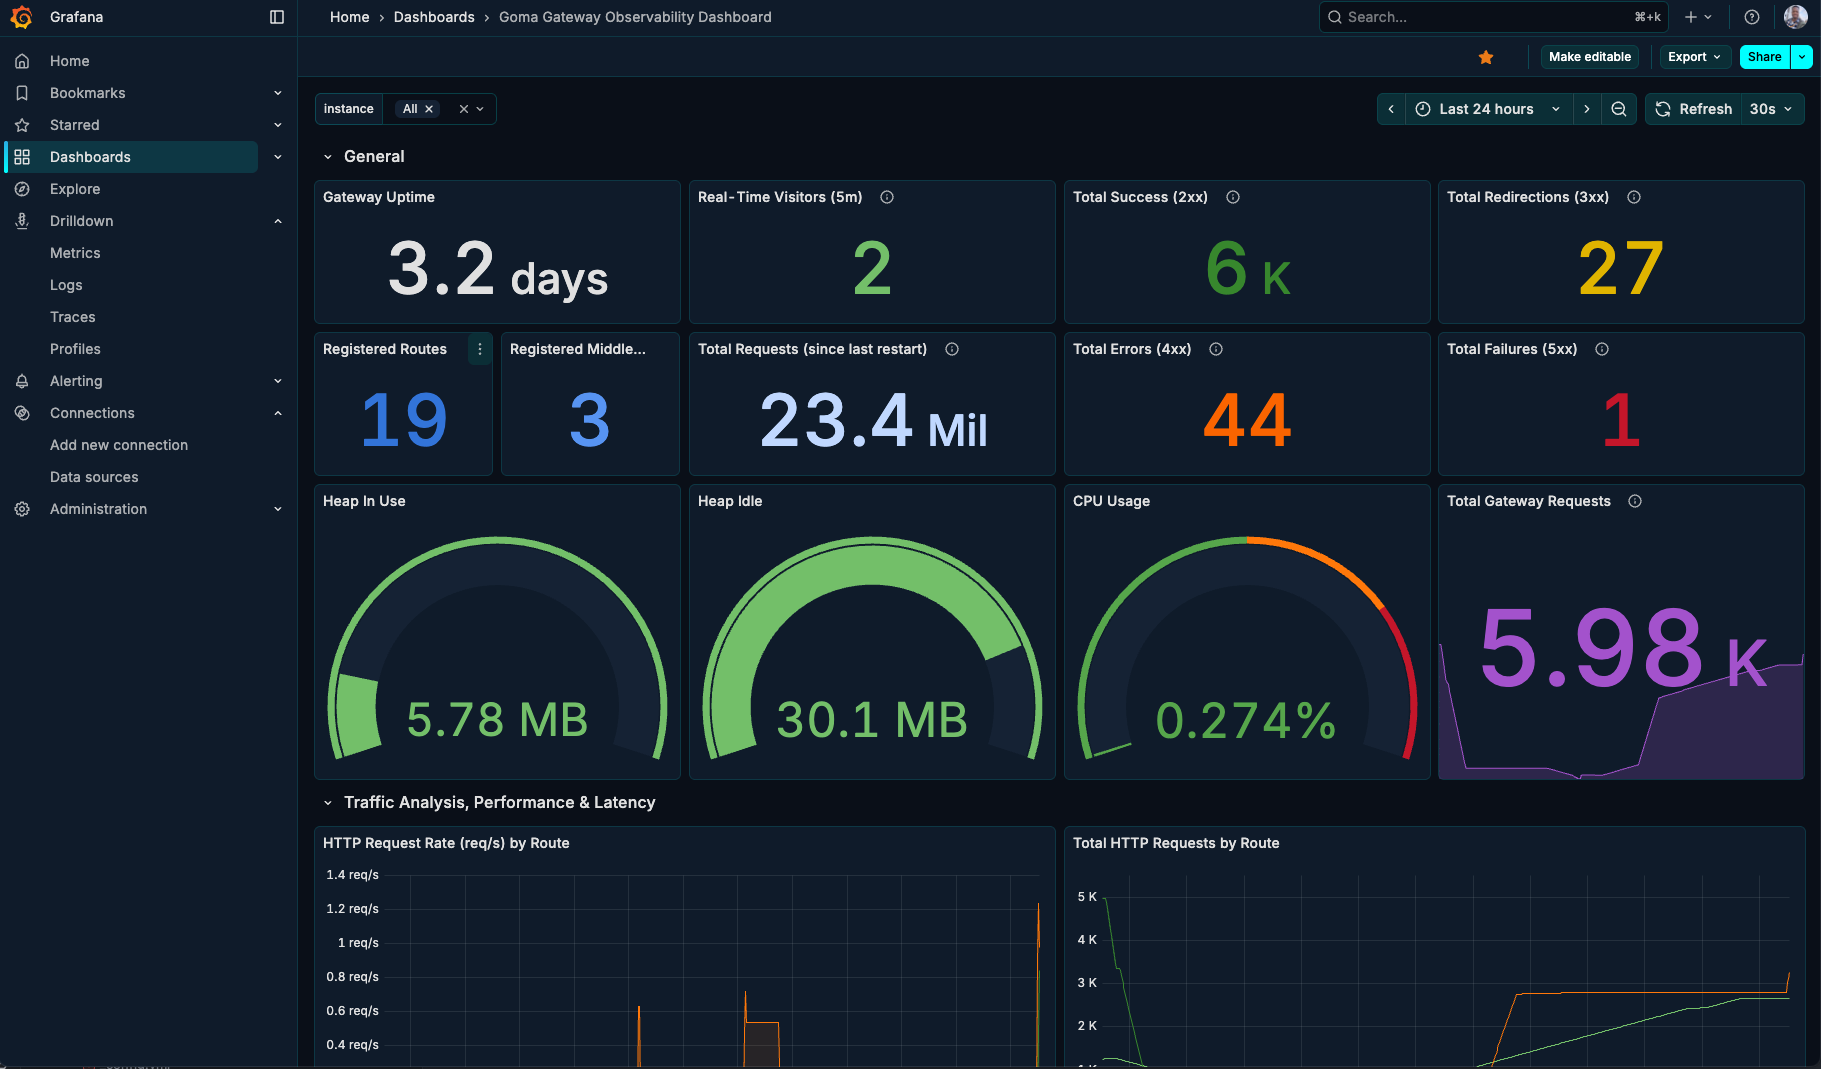
A prebuilt Grafana dashboard is available to visualize metrics from Goma Gateway.
You can import it using dashboard ID: 23799
Dashboard Preview